Final Project - Part 2
23 Nov 2019Storyboard
Research protocol
Target Audience
Because of the universality of my story, everyone can be the audience of my story. Those who just want to raise a dog will be reminded by my story to adopt a dog instead of buying a breeding dog. Those who don’t want to raise a dog may go to the shelter agency to help the stray animals after reading my story.
Goals / Questions
| Goals | Questions |
|---|---|
| Evaluate the engagement of the story. | Are those picture or icon there appropriate? |
| Evaluate the usefulness and completeness of the visualization. | Can people get enough useful and relevant information from the visualization? |
| Evaluate the perceptibility of the visualization. | Do people feel the visualization clear and easy to understand? |
| Evaluate the intuitiveness of the visualization. | Can people who saw this visualization for the first time know what the it is doing? (What confused the person, if any?) |
| Evaluate the aesthetics and engagement of the visualization. | Do people think the graph is beautiful and engaged? |
| Evaluate the logic of story. | Do people feel comfortable about the logic of the whole story? |
Background
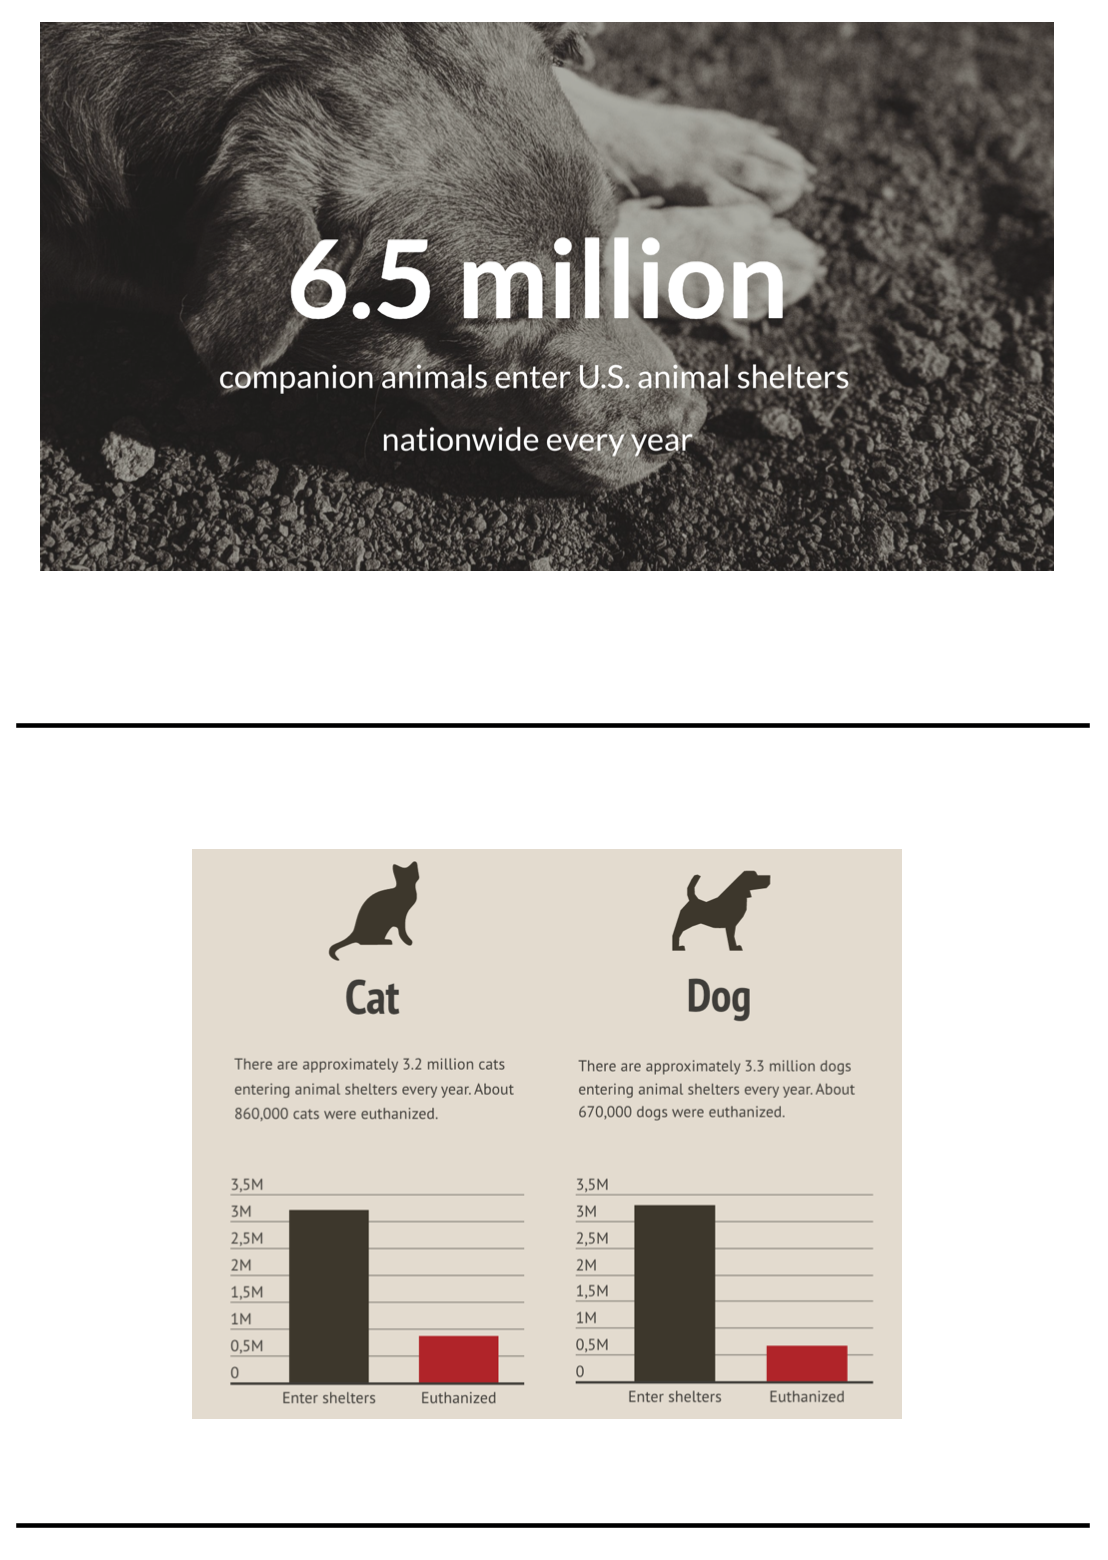
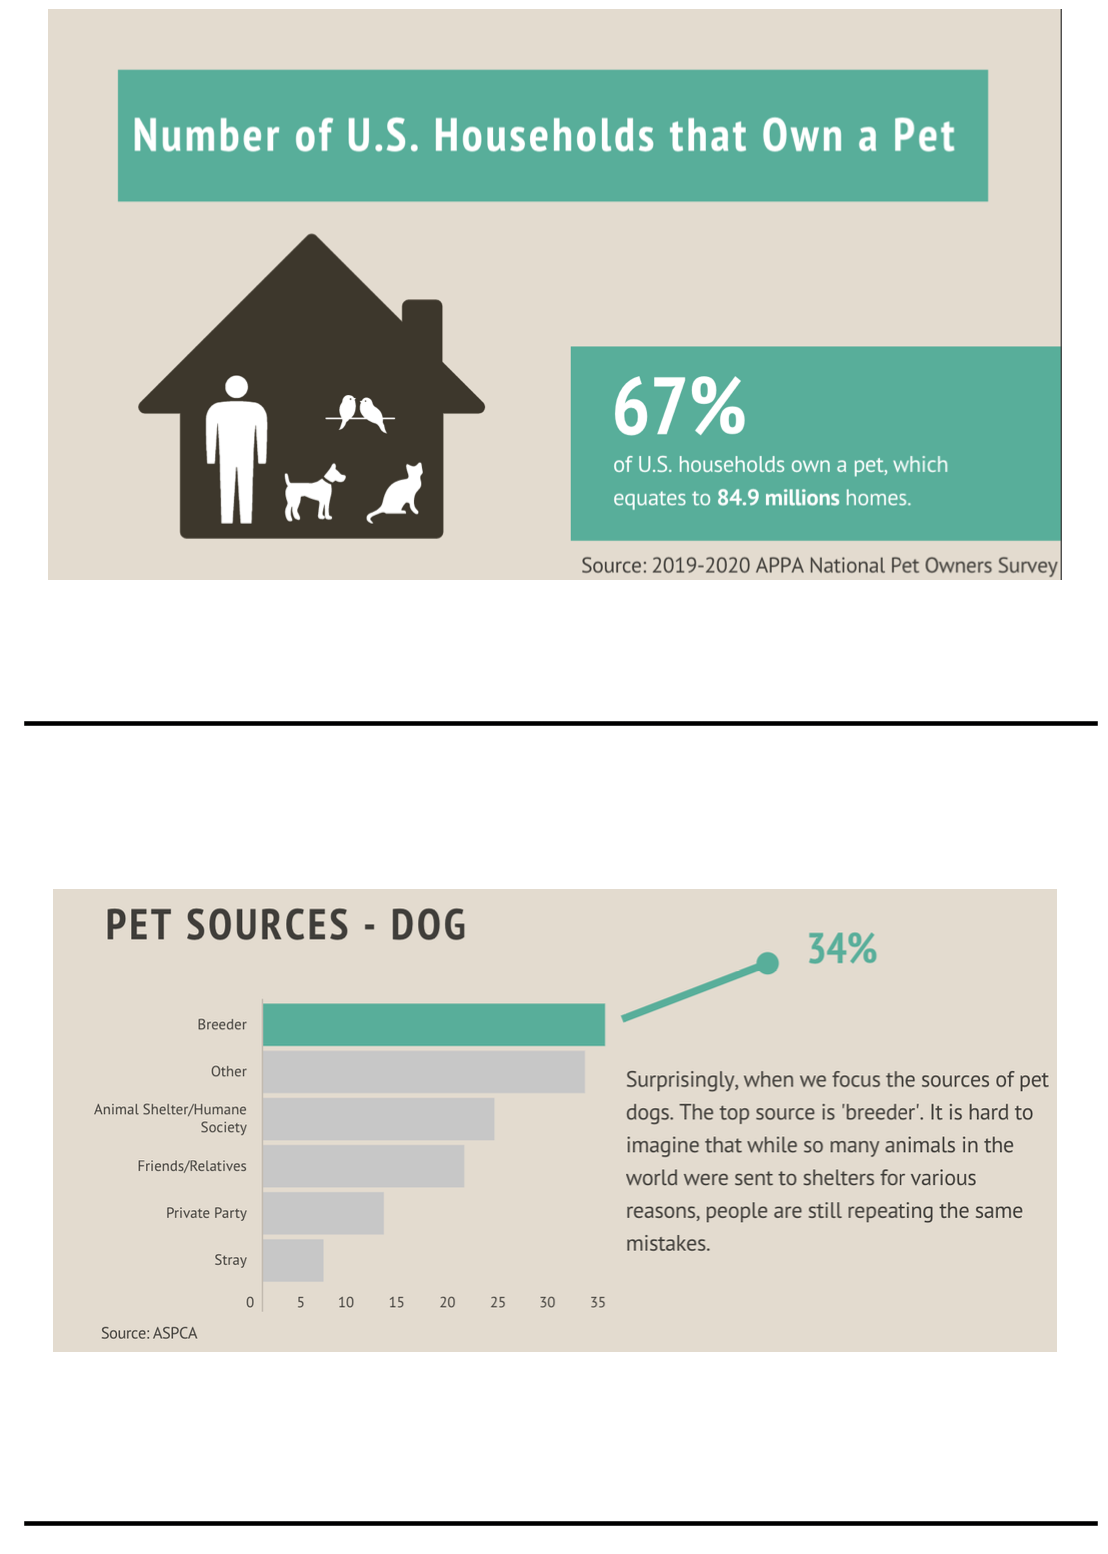
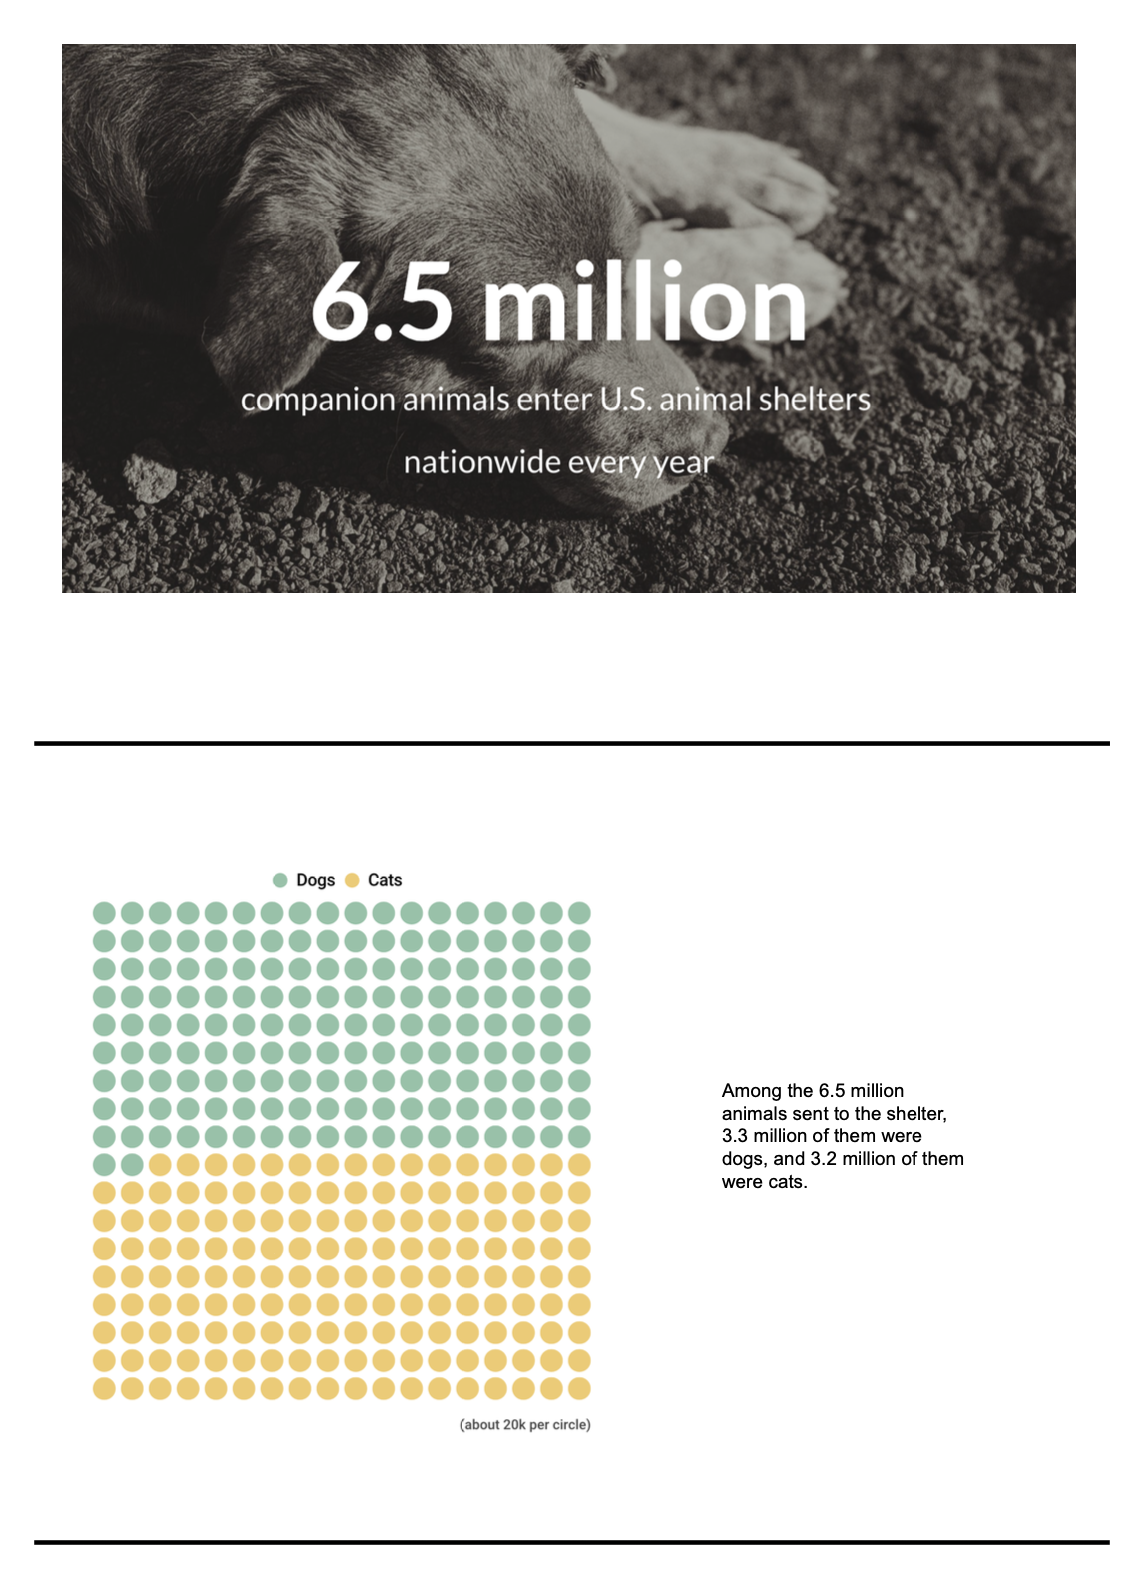
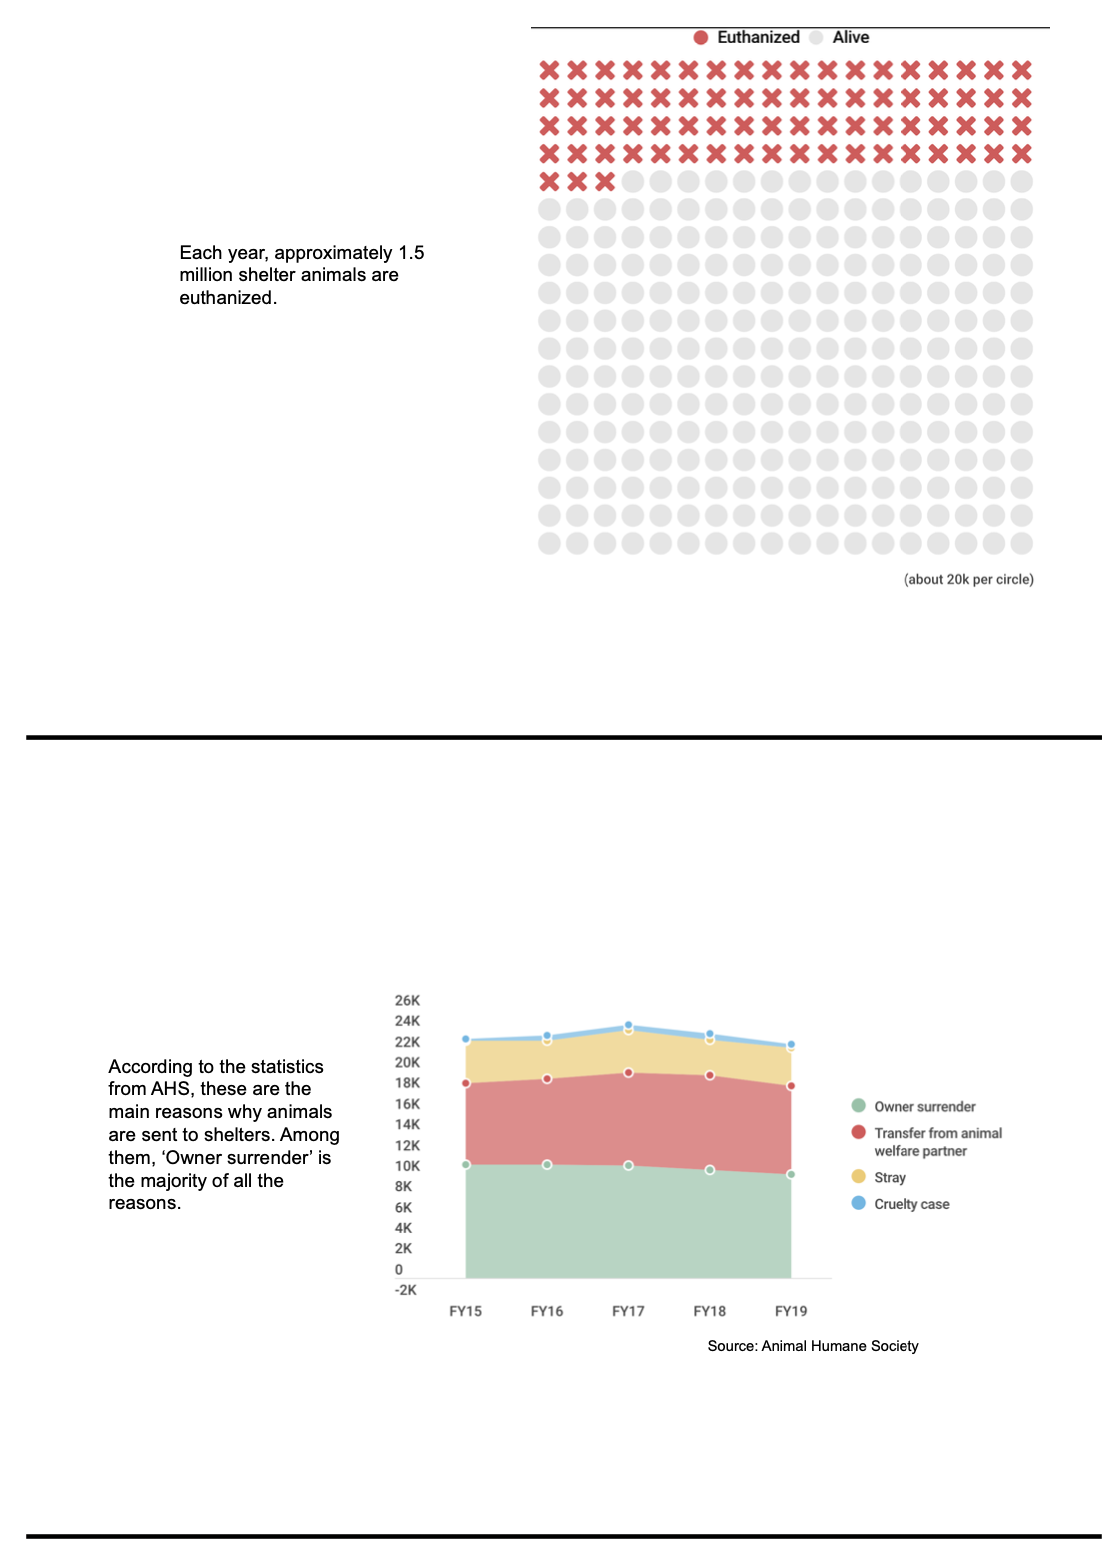
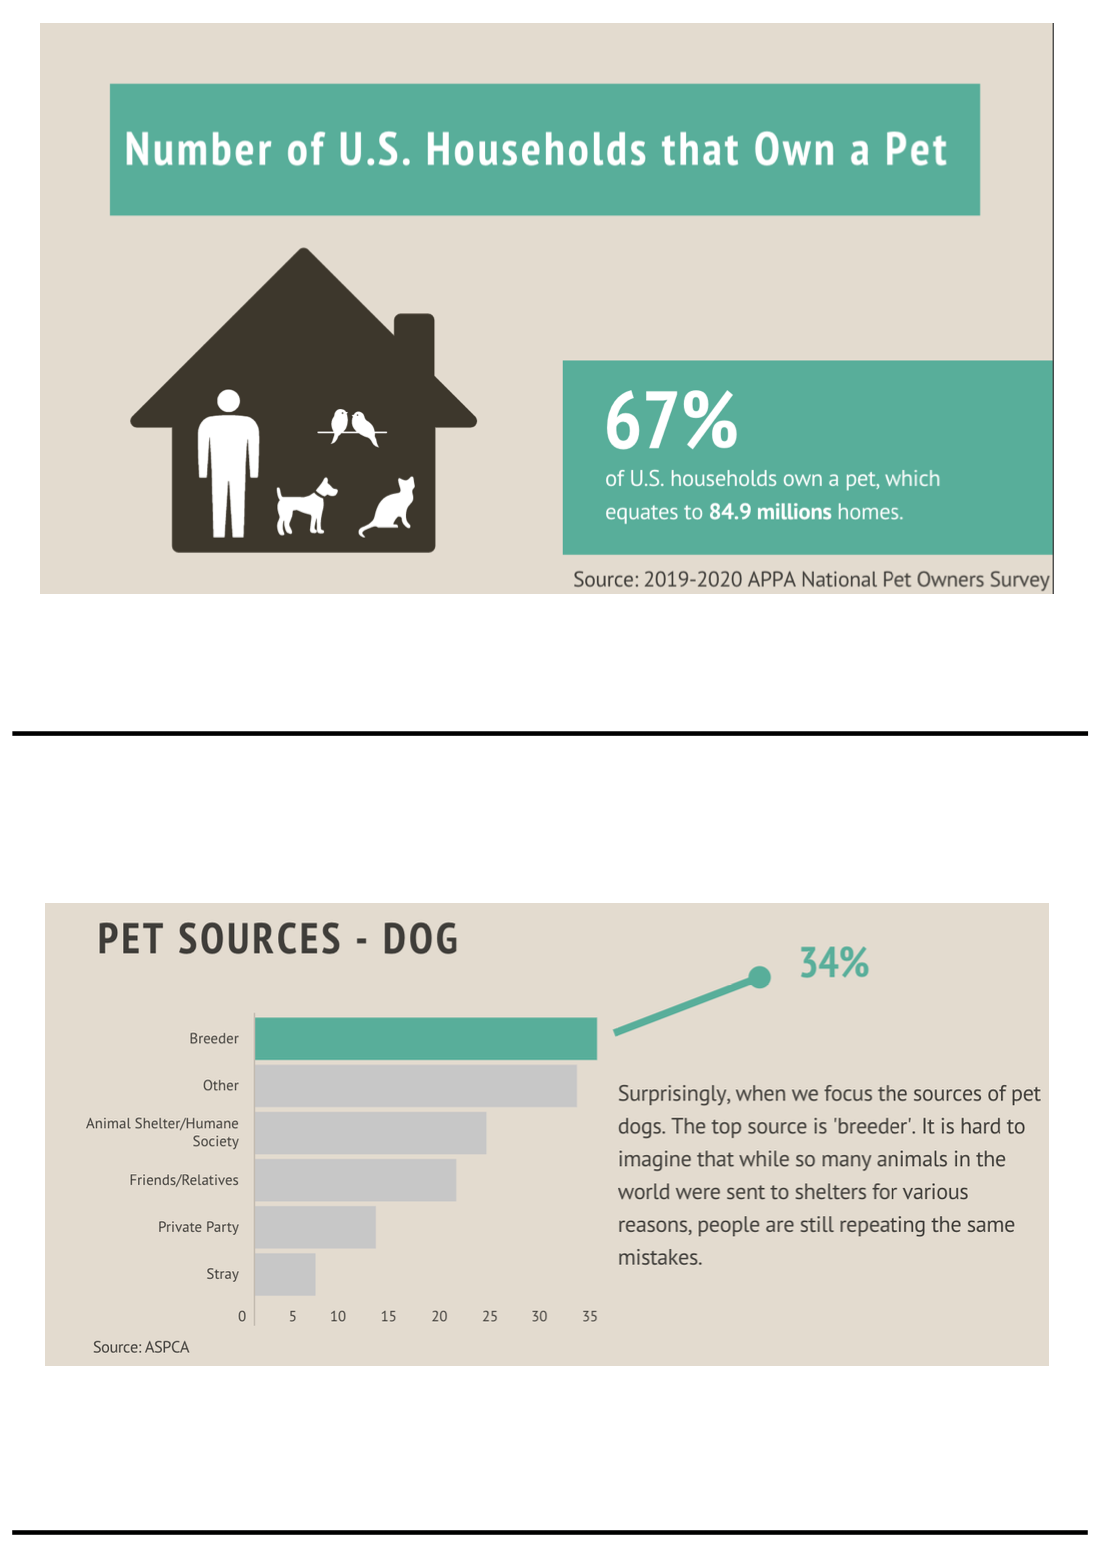
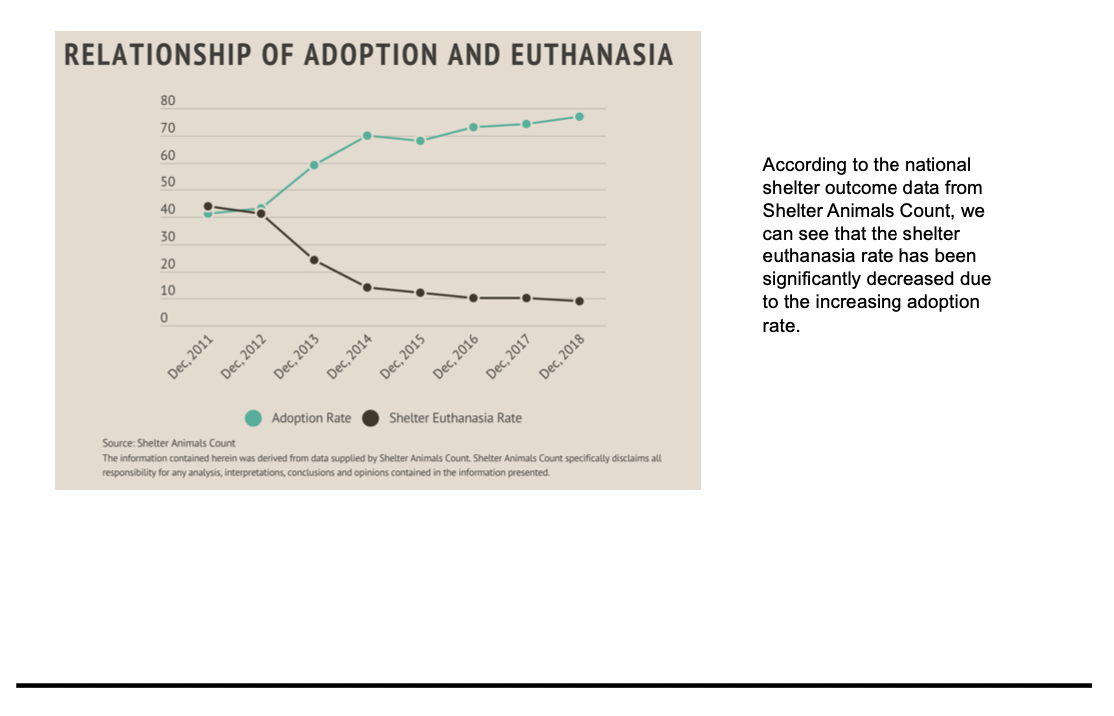
Every year, many animals are sent to shelters for different reasons. However, people tend to buy breeding dogs when they raise dogs. I want to use this story to appeal to people to adopt instead of buying. This research plan is based on the final project of the course 94870-Telling story with data. This project is still in the beta version. I hope to use this research to understand people’s reflections to my story’s logic and data visualizations. The outcome of this research can help me improve the project so that I can better tell the story to the audience.
Participants
In order to test whether my story appeals to the audience is effective or not, I hope to find people in three groups to test my story logic.
- Those people like animals and want to raise an animal in the near future.
- Those people like animals and don’t have the plan to raise an animal in the near future.
- Those people who dislike animals.
Methods
- 10 mins interview
- Notes
- In-person
Script
Introductory comments
Brief introduction: “Hello, my name is Mengyue Wu, a graduate student in Carnegie Mellon University. I will ask you some questions and please feel free to express any of your opinions.” Quick discussion of the objective of today’s test: “The purpose of this test is to gather feedback from the audience to improve my project. Please note that there’s no correct or wrong answers. I am just looking for honest answers.”
Main section
To define the audience group, ask: “Do you like animals? If yes, do you plan to raise an animal in the near future?” “I have prepared slides here. This is just a storyboard of the website. I showed the main process and logic in the storyboard. Please imagine that you are browsing to such a webpage. Please take a look at this slides and mark down anywhere makes you confused.” (Wait for participant to complete viewing) Then I will ask some questions to deepen the research:
- “Would you please tell me what the project is about? Which parts in the webpage lead you to that idea?”
- “Can you get useful information from the data visualizations? Do you think the visualizations are relevant to the topic you determined before?”
- “Do you feel engaged in this project?”
- “Do you think the visualizations are easy and clear to understand?”
- “Do you think this webpage is beautiful?” If I get an answer like “umm…”, I will ask “Which part do you think is not good?”
- “What will you do after viewing this webpage?”
- “What else makes you confused, if any?”
- “Do you have any other questions about the webpage?”
Wrap-up
“Thank you so much for your time and patience! Do you have any questions for me?”
Findings
I completed three interviews with my friends. One of them likes animals but is not willing to raise any pets in the future. One of them likes animals and is planned to raise a pet in the near future. One of them holds a neutral feeling to animals. They fitted into the three groups I planned to interview with.
Positive:
- People could understand the topic easily.
- Most of the visualizations were clear.
- Provided useful information.
- Logic of the story was comfortable for them.
- All the people are willing to try adoption if they want to raise an animal.
- People who don’t want to raise an animal are willing to donate.
Negative:
- The dot plots were not beautiful.
- The visualization of stacked area caused confusion to two of the participants.
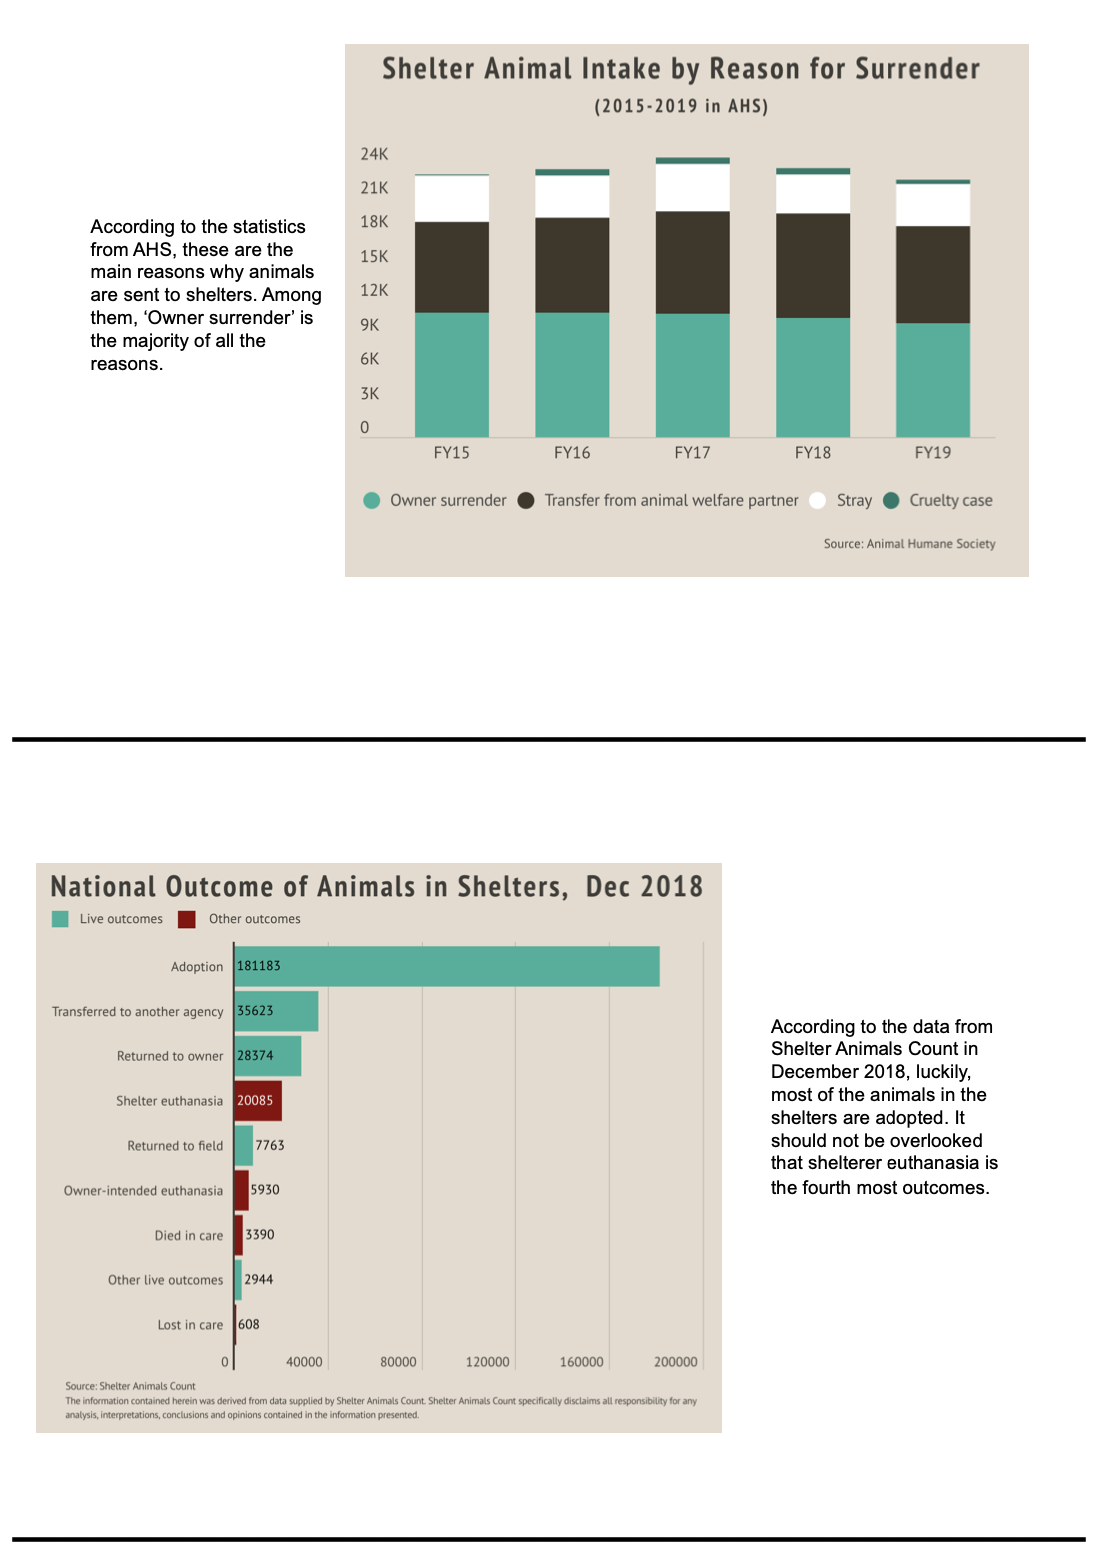
- People wanted more information about what the outcome of those animals in shelters was.
- People wanted to know how they could help and where they could adopt animals.
- The theme of the visualizations was not consistent.
Changes
- Change the dot plots to graphical data visualization.
- Change the style of the AHS visualization.
- Create another visualization to show the outcomes of the sheltered animals.
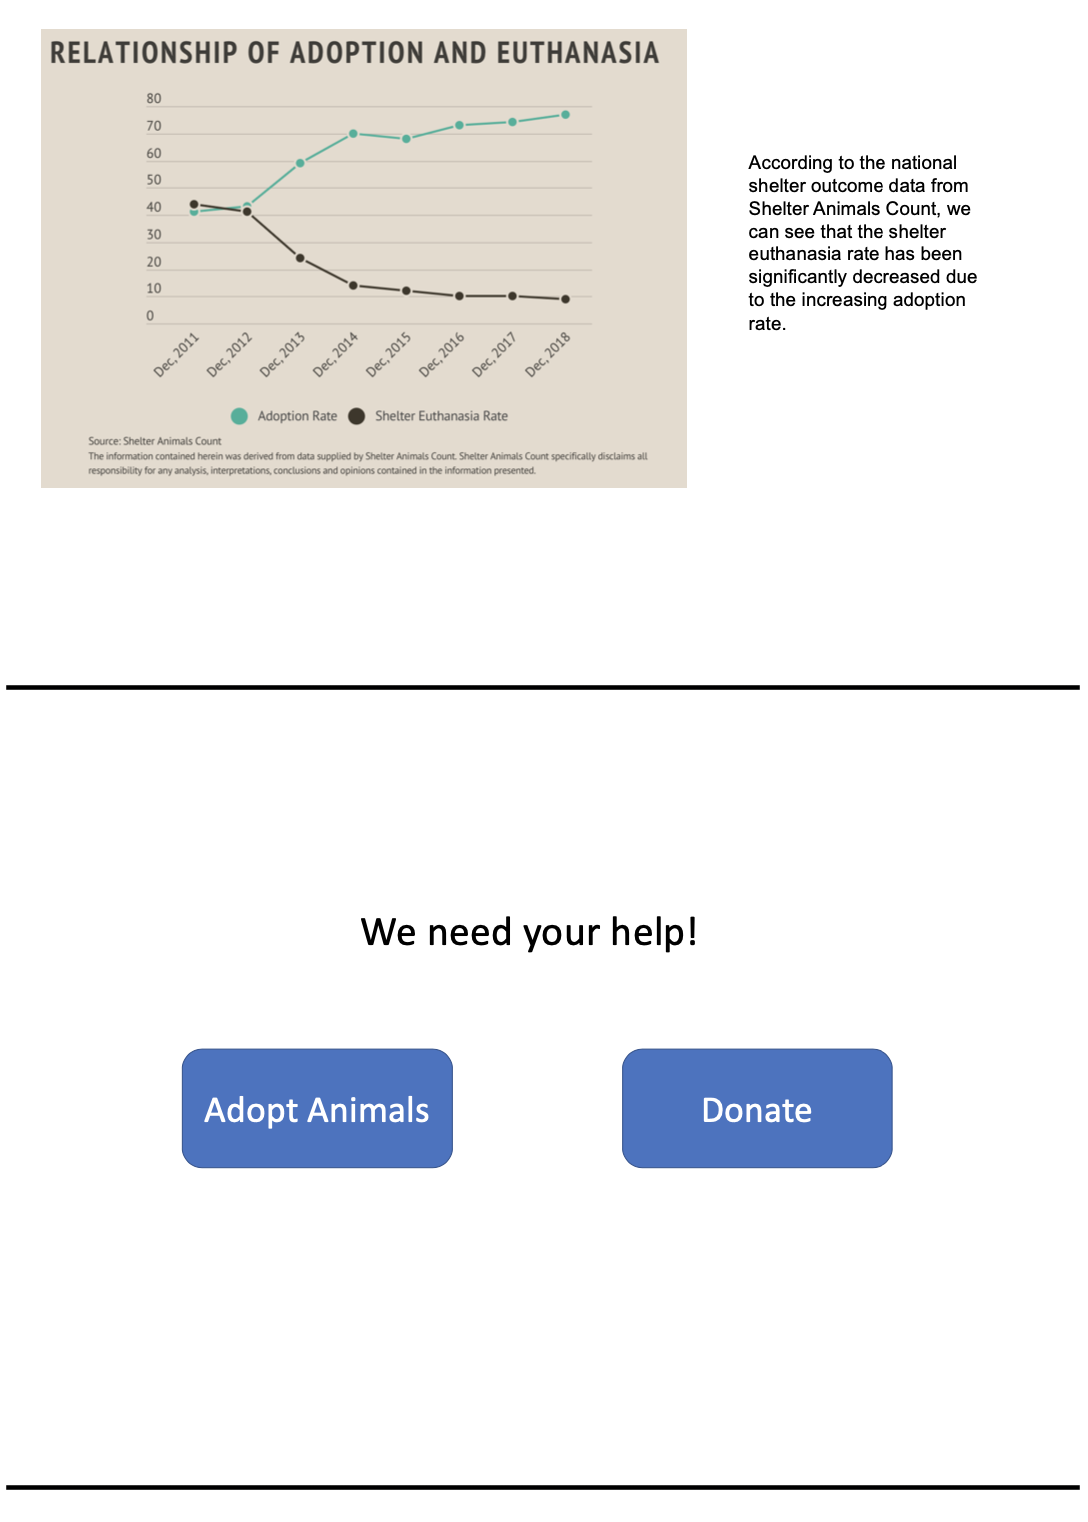
- Add the recommended approaches at the end of the story.
- Make the theme of visualizations consistent.
Revised storyboard